Any discussion of inequality includes an implicit normative or ethical comparison of distributions; a certain distribution of some good, or of gains in that good, is acceptable or not acceptable, is better or worse, is improving or stagnating. If discussions of inequality also inevitably involve rankings and comparisons of different distributions, then how inequality is defined and measured will affect these rankings and comparisons. The choice of measurement of inequality is therefore not value neutral.
Relative vs. Absolute Measures of Inequality
Relative measures of income inequality are based on proportions of a total amount, or on the ratio of one group or individual’s income to another. An absolute measure depends on the actual numeric distance between groups or individuals of the unit in question. For example, suppose one individual had $10, and another $100, and then both experienced an increase of 20%, so that the first individual now has $12, and the second $120. Relative measures of inequality would register this movement as no change in distribution, since both incomes increase by the same percentage, despite the fact that, in absolute terms, the difference in income has changed from $90 to $118. It would be at least equally reasonable to consider this change an expansion of inequality, or, at least, non-inclusive growth.
The most commonly used measures of income inequality, both in academic literature and popular discussion, tend to be relative, rather than absolute measures of inequality. The most commonly used measure of income inequality in the field of economics research for many years has been the gini coefficient. The gini is a purely relative measurement that assigns a number from 0 to 1, with 0 being perfect equality and 1 being perfect inequality. Other popular measures of inequality are often based on comparisons of proportions of total income along the income distribution, such as a comparison between the top 10% and bottom 40% of income earners sometimes referred to as the ‘Palma ratio,’ or the proportion of income of the top 1% of earners that is the focus of the research of Piketty, Saez, and Zucman, as well as of popular protest movements. These are all relative measures. (The more exotic ‘generalized entropy’ class of measures sometimes found in the literature, such as the Thiel Index, are also relative measures).
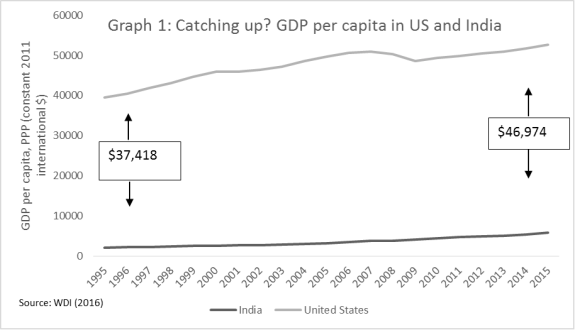
For a simple example of how the use of only relative measures can change perceptions, consider the story of developing countries, such as India, “catching up” to the US. It is quite common to hear the idea that India and China are gaining on the US economically, and from a particular perspective that is clearly what is happening; India has consistently been growing at a higher % growth rate than US, and until recent policy missteps, was considered the fastest growing country globally. Undoubtedly, this fast growth is an important phenomenon and there is a great deal of change happening within India. However, it might be surprising to many to learn, that after two decades of faster growth, the gap between India and the US’s GDP per capita has actually grown, in absolute terms. See graph 1, above.
A quick back of the envelope calculation suggests that if India’s GDP per capita were to continue to grow at 5% annually, and the US’s were to grow at 1.5.% (the approximate average from last 20 years for both), the absolute gap would not even begin to shrink for more than three decades! These average growth rates would need to continue for almost 70 more years before the two countries had an equal GDP per capita. Besides the unlikelihood of these rates continuing for that period of time, its not even clear that it is possible for all of the people in currently less wealthy countries to equal current levels of production in wealthy countries, due to resource and other environmental limitations. It seems fair, then, to ask in what sense Indian output per person is really “catching up.”
Right, Left, and Center
Purely absolute measurements, however, may also be misleading. As S. Subramanian of the Madras Institute of Development Studies has noted, most would not consider a situation in which one person had $0 and another had $1 million to be equal to one in which the first person had $1 million and the second has $2 million, despite the absolute inequality being the same in both cases. A third, intermediate type of measure, explained shortly, is also a possibility.
The French economist Serge-Christophe Kolm provided definitions of these three types of measures, and also equated them to different political or normative perspectives. Kolm categorized measurements of inequality as “rightist,” “centrist,” and “leftist,” depending on their treatment of inequality as an absolute or relative concept. Leftist measures are sensitive to absolute changes; they do not change when all incomes go up by the same absolute amount. An example of this type of measure would be the absolute gini, which is a standard gini coefficient multiplied by the mean of the distribution. Kolm defines centrist measures as measures which show increased inequality when average incomes rise and the relative distribution stays the same, and decreased inequality when all incomes rise by the same absolute amount. Rightist measures are purely relative; when all incomes go up in the same proportion, they are unchanged. The use, typically, of only one of these three equally legitimate types of inequality measures disguises an implicit judgment on how gains of growth should be distributed. Subramanian remarks that “the population of a leftist perspective enables one to see that the hitherto undetected value-system underlying the relative view is rightist.”
Robert Wade of LSE has argued that absolute measures are the most relevant in comparing income and wealth inequality over time in situations of growth, and would be a both a better indicator of true inequality and serve to increase the political salience of issues of distribution. Subramanian, on the other hand, advocates for centrist measures on the grounds that they hold a number of desirable properties that neither of the “more extreme” rightist or leftist can satisfy. These include an intermediate gini, which is the product of the absolute and relative gini, as well as the measurement proposed by the mathematician Manfred Krtscha and subsequently endorsed by Subramanian, which is the coefficient of variation (a relative measure of distribution) multiplied by the standard deviation (an absolute measure). Subramanian explains that any product of an absolute and relative measure of poverty will have the characteristics of a centrist measure. Subramanian also argues that the Krtscha index is ideal for measuring changes in distribution in a situation of growth.
An Applied Example: Measuring Global Inequality
To provide an example of how using a different measure of this sort can produce a different narrative, I revisited the well-known work of Branko Milanovic, who tracked income inequality globally over the last three decades. One portion of Milanovic’s work used gini coefficients to track both inequality between countries’ GDPs per capita, weighted by population, and the global population as a whole. I’ve (roughly) recreated his results below, using data from Maddison and Lakner-Milanovic, as in the original.

The important point to note here is the trend of declining inequality. Now, using the same data and same two concepts of inequality, but measured using the Krtscha Index rather than a gini coefficient, the graph appears like so:

Using an centrist measure, we find global inequality between countries rising, rather than falling, throughout the 1960s, 70s, 80s, and 90s. There is a slight drop in the last decades, but inequality remains at a higher level in 2010 than it was in 1960, a very different result than that found using the gini. The interpersonal global inequality, calculated for 1988, 1993, 1998, 2003, and 2008, found a slightly downward trend using the gini, but a rising trend using the Krtscha index. Ultimately these two graphs show a very different story of what has happened to global income inequality over the last half-century.
Conclusion
At this point, a reader might object, “you have chosen a different measure, of course you have found different results!” However, that is precisely the point. The choice of measurement is determinate of a researcher’s conclusion, and the choice of measurement is not value-neutral, but indicative of an implicit judgement about what type of inequality we should care about and on how the gains of growth should ideally be distributed. If we are going to depend on relative measures virtually exclusively, then that choice should be explained and defended, not merely the result of network effects and inertia.
Joshua Greenstein is Assistant Professor of Economics at Hobart and William Smith Colleges.

Enjoyed the discussion. Took me back several decades when I played around with alternate measures for Pakistan in the hope that some would be more sensitive to mass impoverishment as consequence of high inequality. Decomposition by income source also suggested the need to separate ‘bad’ from ‘good’ inequality in the sense of distinction.between what aggravated or helped reduce impoverishment.
LikeLike
Thank you for your comment. I definitely agree that there are many other important factors that go into determining the inclusiveness or not of growth, beyond any individual measure of overall inequality.
LikeLike
Could you please explain why Kolm attaches the label of “leftist” to absolute measures and “rightist” to relative measures? I am a left-wing person who studies poverty and inequality and I do not see immediately why these labels fit the conception of inequality they are attached to. Kolm’s linked papers do not seem to explain his categorisation (unless I missed something, I just skimmed).
In general I am more used to left-wing people being attached to a view which takes relative position in society (and so-called “relative deprivation”) more seriously than conservatives, who tend to care only about “absolute deprivation”, if they care at all.
In any case, thank you for the thought-provoking post, I need to think about its implications a bit more.
LikeLike
I think Subramanian’s pieces linked above will be helpful to you on this question. But quick answer might be; if all parts of distribution were to grow in same proportional amount, a relative measure would show this change as constant inequality, even if absolute distance between the lower and upper ends were getting better. There could also be situations, like the US-India example above, in which a lower end of the distribution was growing faster proportionally, and so a relative measure of inequality would show declining inequality, even as an absolute measure showed increasing. So, basically, in most cases, an absolute measure would require a greater portion of income increases going towards the lower ends of distribution than a relative measure would in order to show a decline in inequality (in all cases maybe? I’d have to think about that).
As to the second part of your comment- remember we are talking about absolute differences here- not absolute deprivation- so it is still a measure that is about an individuals position related to others in society.
LikeLike
Thank you for this reply! I still need to read the Subramanian piece but I will do that. However your explanation makes sense.
Your point is also taken regarding position rather than deprivation. However I still wonder about some of the implications of the measure. It is common for there to be large absolute differences in income between households/individuals at the very top of the distribution, as these people earn high incomes and an 1% difference in income, for example, is then a very large absolute deviation. Does an absolute measure not put undue influence on these differences, coming from a “left perspective”? Perhaps I can give an example of a hypothetical income distribution to make this clear.
Say there is a household in the bottom percentile of the income distribution, with an income of $1000 p/a. Then say there is a household in the 99th percentile, with an income of $1,000,000 p/a. Then say there is a household in the 100th percentile with an income of $3,000,000 p/a. I don’t think this is a wildly unrealistic income distribution.
Wouldn’t the absolute inequality measure suggest that we should care more about inequality between the households at the 99th and 100th percentiles, rather than that between the 1st and 99th percentiles? We go further in addressing income inequality by reducing reducing differences between households at the top than we do between households at the bottom and near the top? Is this not somewhat perverse from a left perspective?
LikeLike
This is very good. Enjoy reading. Got curious to know about the GDP per capita gap between Brazil and the US…
LikeLike