In this post we show that an increase in aggregate demand first generates an increase in the use of productive equipment and then an increase in productive capacity. This suggests we do not need to worry about inflation after a fiscal or monetary stimulus to boost aggregate demand, but can rather expect higher investment in the long term along with utilisation returning to its pre-shock levels.
A stylised fact that characterises modern economies is that part of the installed productive capacity is persistently idle. By productive capacity I mean the productive equipment (mostly fixed capital goods) in existence, together with that part of the workforce which is required to operate it. As we can see in Figure 1, in countries as diverse as Belgium, Finland or Lithuania, the effective utilisation of installed capacity often gravitates below 100%, and around 80% on average worldwide.
Figure 1. Installed capacity utilisation by country (1998Q1-2017Q4).
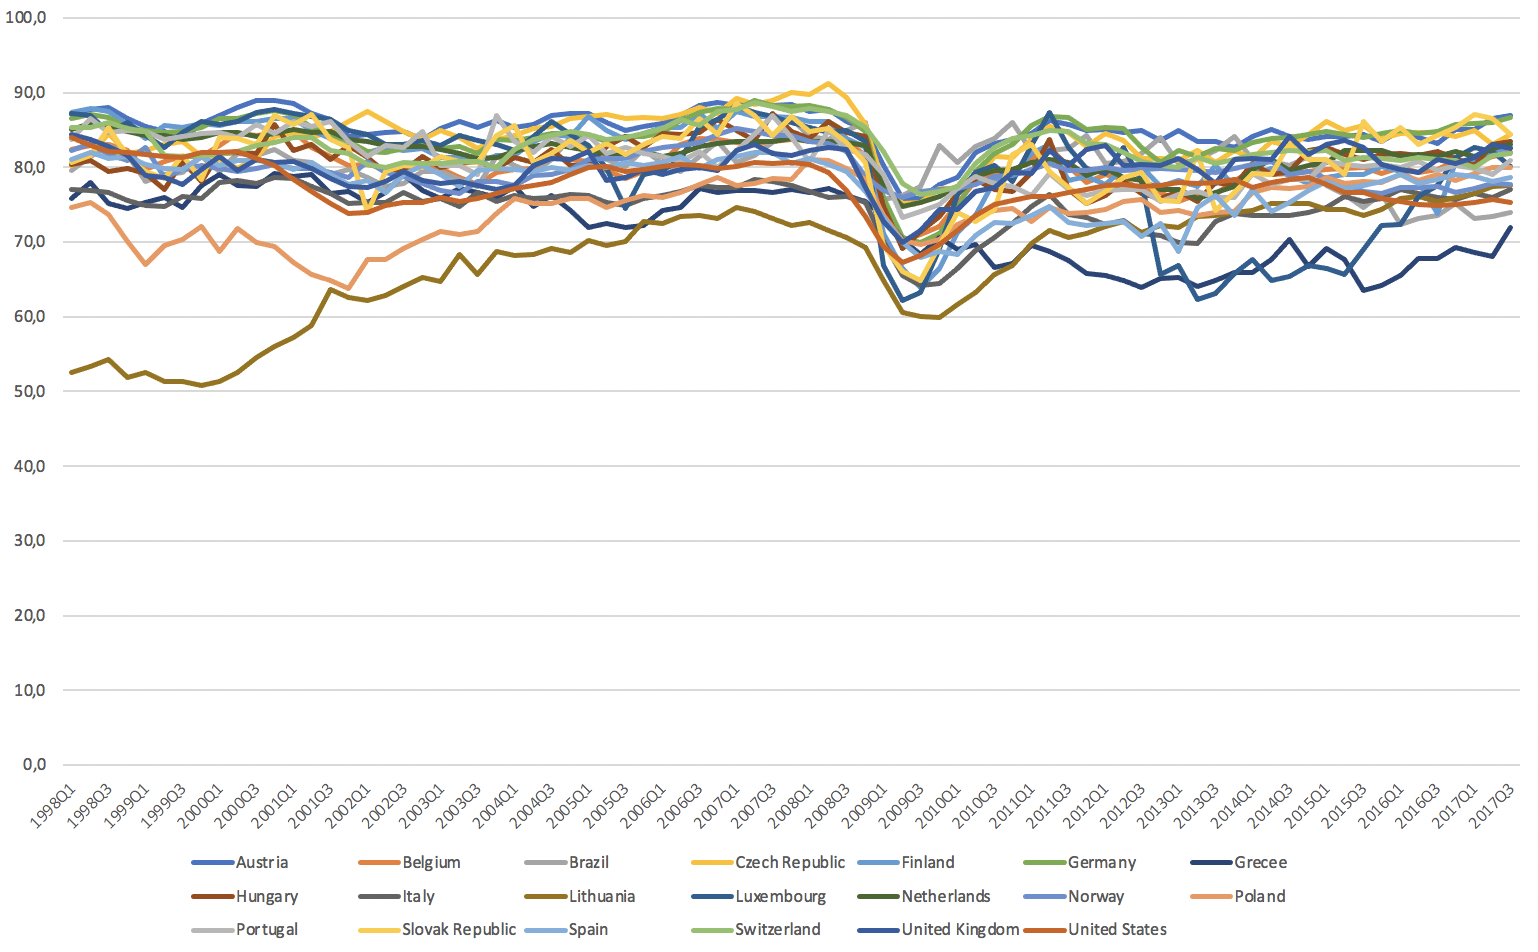
Source: see Appendix I.
The academic consensus is that there are large margins of idle capacity planned by entrepreneurs. The reasons why entrepreneurs plan to operate with idle capacity vary according to the school of thought considered. At the risk of making a drastic simplification, we can say that while some authors think that entrepreneurs do so in order not to lose market share in the face of changes in demand, others tend to think that there is a rate of utilisation of installed capacity that does not accelerate inflation (Non-accelerating inflation rate of capacity utilisation, NAICU).
For some authors, large margins of idle capacity is the way in which the presence of persistently unused resources manifests itself (Ramey, 2020). When making an investment, entrepreneurs plan the size and intensity of future use of the capital stock over several business cycles – determined precisely by the duration of the stock. This level of utilisation, the expected average level, which the entrepreneur calculates during the investment process, is known as the normal level of utilisation of installed capacity (Ciccone, 1986; 1987). This level of idle capacity is usually planned taking into account economic fluctuations, mainly in order not to lose market share, among other factors (Lanzillotti, 1958, 1959).
As normal utilisation of installed capacity is a variable that is not usually measured by national statistical institutes, no time series are available. However, it is possible to obtain time series of effective capacity utilisation. In this post, we will use time series of the US economy to explore what mechanisms could explain the tendency towards normal capacity utilisation.
The tendency towards normal capacity utilisation: the case of the US economy
Although effective utilisation of installed capacity (U) has been on a declining secular trend in the US since the 1950s (Pierce and Wisniewski, 2018), it has remained relatively stable at around 79.5% on average, in line with the global level. In addition, the level of activity – represented here by the level of manufacturing production (MP) – has shown a clear positive trend until stagnating in the late 2000s, as can be seen in Figure 2.
Figure 2. Installed capacity utilisation (dotted line) and production level (2017=100, solid line) in the United States (1948Q1-2021Q1).
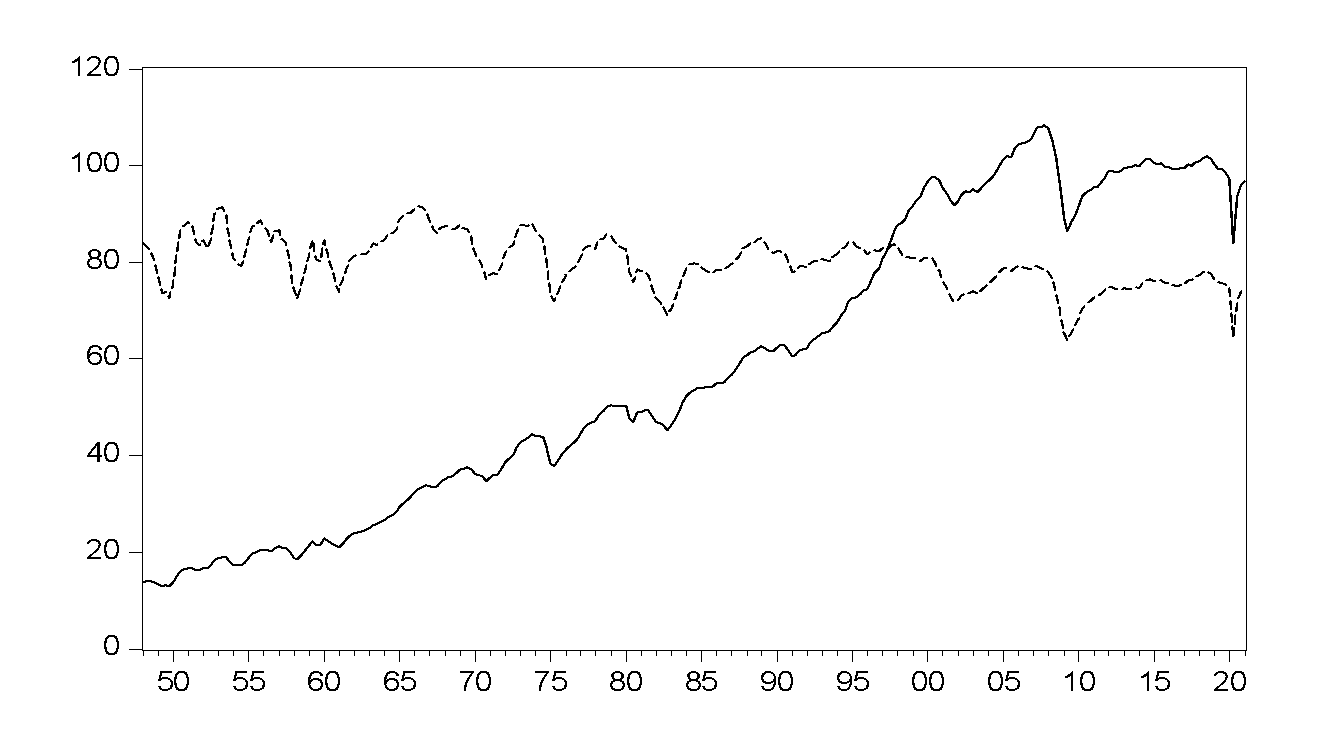
Source: see Appendix I.
An interesting question to ask is what happens to the level of capacity utilisation when the level of activity increases in an economy like the US. In this post we carry out two exercises to try to uncover some answers to this question. Firstly, we take the level of manufacturing output (MP) and see what happens to the utilisation of installed capacity (U). As we can see in Figure 3, looking at a 30-quarter period, a persistent increase in the level of activity (MP) – which remains above the initial level, even until the last period – has a transitory impact on the level of utilisation (U). There is a peak in the latter in the second quarter, and the effect slowly diminishes until utilisation returns, around the tenth quarter, to the pre-shock level.
Figure 3. Impact of an increase in the level of production (MP) on the level of output (left) and installed capacity utilisation (U, right) in the United States (1948Q1-2021Q1).
Response of MP to MP shock Response of U to MP shock
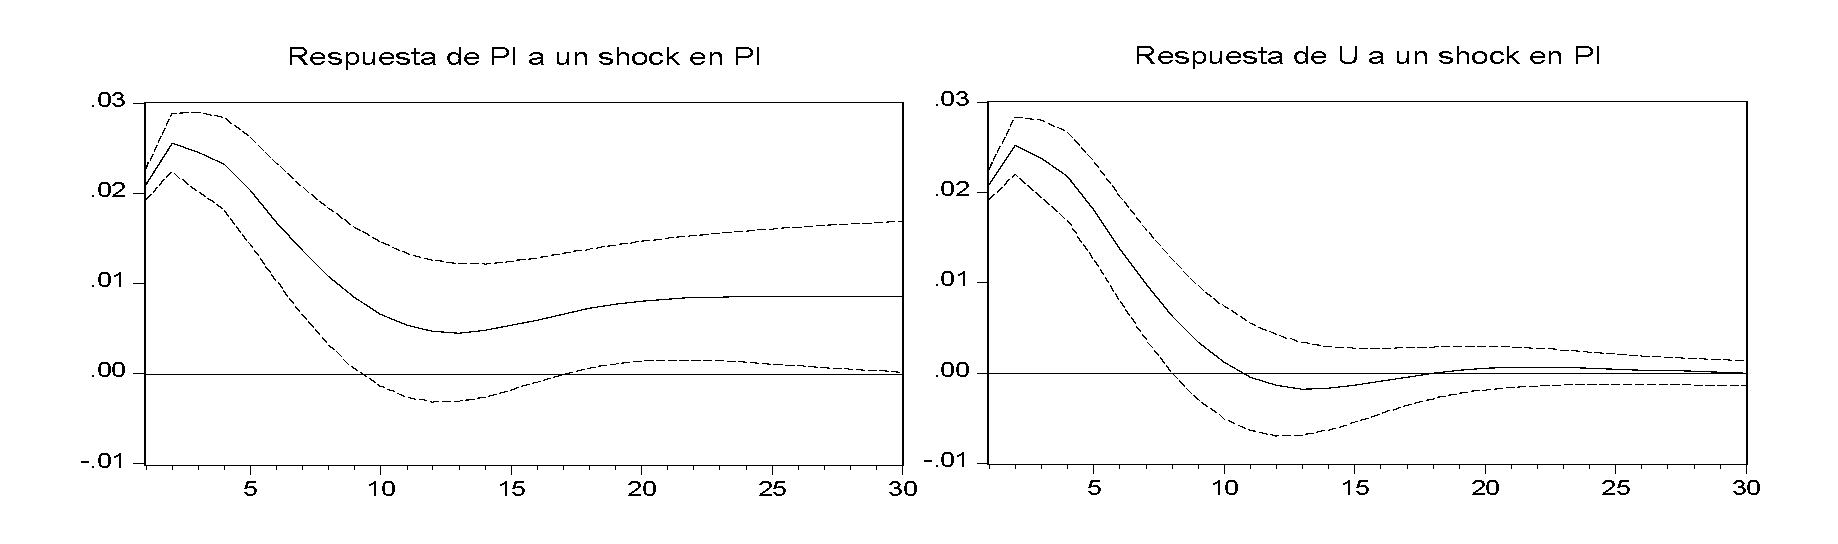
Source: see Appendix I.
Given that the effect of the level of activity on capacity utilisation is transitory, the question is: what is the adjustment variable? If we allow ourselves a great simplification, we can find two main answers in the literature. On the one hand, there are those authors who think that the adjustment occurs on the quantity side (first, private investment and, as a consequence, an increase in the level of productive capacity); on the other hand, there are those who argue that the adjustment operates through an increase in the level of inflation – an acceleration of inflation.
In the first case, when demand for goods increases persistently, entrepreneurs first respond by increasing capacity utilisation and then increase productive capacity. In this case, investment, which is fully induced by the level of production, is a “defensive” response by entrepreneurs in order not to lose markets to their competitors. The adjustment is then through an increase in the share of private investment in output. In the second case, entrepreneurs increase the utilisation of installed capacity, but also persistently change the level of inflation (Corrado and Mattey, 1997).
Secondly, we try to lay the groundwork to begin to understand what the adjustment variable actually is. Using the same methodology mentioned previously, we take the level of production (MP), the level of prices (P) and the level of productive capacity (K). As can be seen in Figure 4, a persistent increase in the level of production (MP) has a positive and persistent impact on the level of prices (P) and also permanently on the level of productive capacity (K).
Figure 4. Impact of an increase in the level of production (MP) on the level of output (left), the level of prices (centre) and the level of productive capacity (right) in the United States (1948Q1-2021Q1).
Response of MP to MP shock Response of P to MP shock Response of K to MP shock
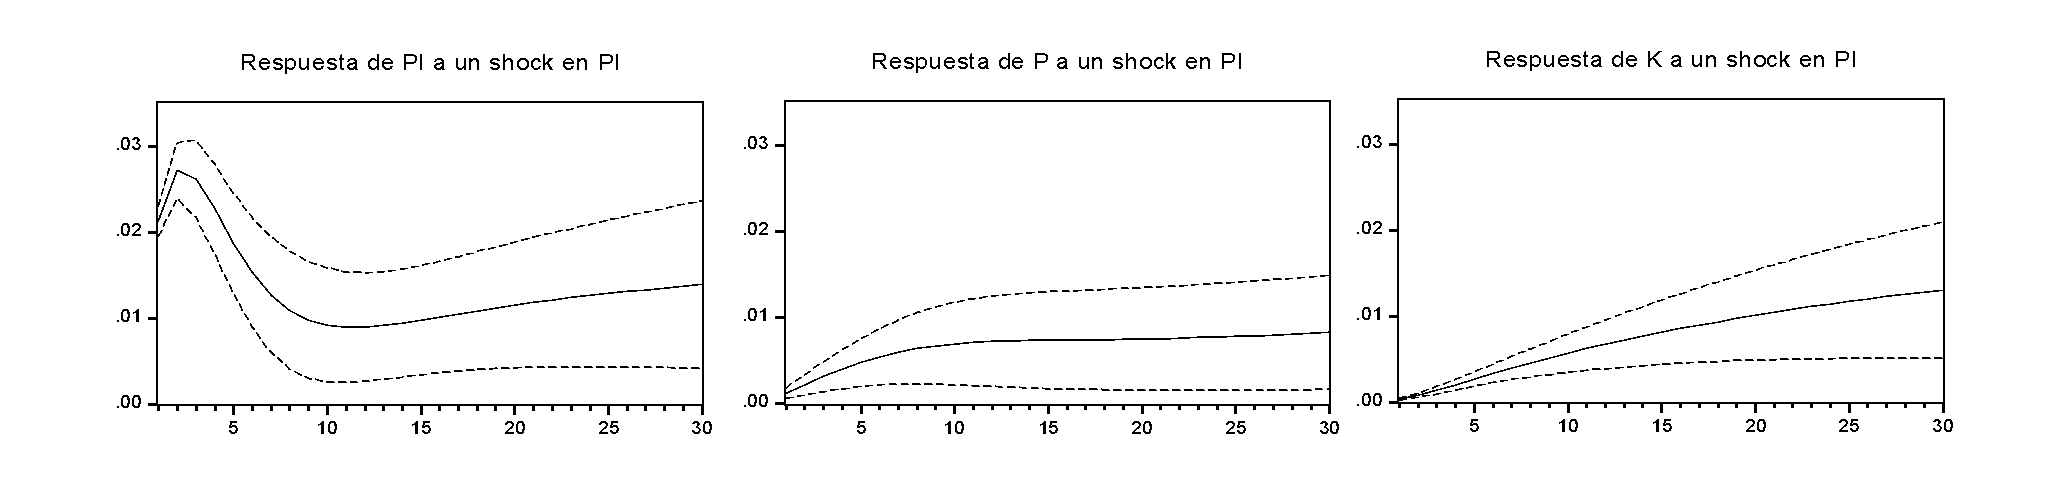
Source: see Appendix I.
Now, what about inflation? Repeating the same exercise, but looking at the level of inflation (instead of the price level), we find that the effect is transitory. In Figure 5, we can observe this result. Although slightly longer lasting than the effect on capacity utilisation – about 5 quarters longer – we confirm a transitory increase in the level of inflation.
Figure 5. Impact of an increase in the level of output on the level of output (left), the level of inflation (centre) and the level of productive capacity (right) in the United States (1948Q1-2021Q1).
Response of MP to MP shock Response of INFLATION to MP shock Response of K to MP shock

Source: see Appendix I.
Conclusions
To summarise, the exercises seem to suggest that changes in the level of activity generate transitory effects on capacity utilisation. As for the adjustment variables, the price level rises, but so does the level of productive capacity. Finally, the effect on the level of inflation is transitory. Although this exercise is inherently very limited, and as with any empirical exercise the results should be taken with caution, we will try to provide some tentative explanations.
We can therefore conclude that it is a stylised fact that modern economies operate with margins of idle capacity. In the literature we find that this idle capacity is planned by entrepreneurs. On the basis of the econometric exercises conducted, we can further conclude that:
- When the level of activity rises persistently, the price level also rises. This would be in line with the adjustment through “prices”. This remains to be analysed in depth, but again, being reductionist, we can find two explanations. One possible explanation is that there may be supply constraints that do not allow demand to be satisfied in the short run. From an alternative point of view, given that an increase in activity levels generally brings with it an increase in the level of employment, in the bargaining power of workers and, hence, in wages, the rise in the price level could be explained as a reaction of employers to this process.
- The level of activity also turns into an increase in the level of productive capacity. This would be in line with the idea of adjustment through “quantities”. When entrepreneurs find that the level of demand increases persistently, they increase utilisation in the short run, in order not to lose market share, and adjust their productive capacity in the long run. In this case, investment would be fully induced by the level of output.
- Finally, the impact of an increase in the level of activity on inflation is transitory.
If the economy is demand-driven, any increase in the autonomous components of aggregate demand will affect the level of productive capacity and the price level in the case of the United States. Since the effect on inflation is transitory, these results support the view that the US government should try to pursue full employment policies, as the risks of inflationary episodes are negligible.
References
Ball, L. M. (1999). Aggregate demand and long-run unemployment. Brookings papers on economic activity, 1999(2), 189-251.
Ball, L. M. (2009). Hysteresis in unemployment: old and new evidence (No. w14818). National Bureau of Economic Research.
Blomström, M., Lipsey, R. E., & Zejan, M. (1996). Is fixed investment the key to economic growth?. The Quarterly Journal of Economics, 111(1), 269-276.
Ciccone, R. (1986). Accumulation and capacity utilization: some critical considerations on Joan Robinson’s theory of distribution. Political economy, 2(1), 17-36.
Ciccone, R. (1987). Accumulation, capacity utilization and distribution: a reply. Political Economy, 3(1), 97-111.
Corrado, C., & Mattey, J. (1997). Capacity utilization. Journal of Economic Perspectives, 11(1), 151-167.
Deleidi, M., & Mazzucato, M. (2021). Directed innovation policies and the supermultiplier: An empirical assessment of mission-oriented policies in the US economy. Research Policy, 50(2), 104151.
Freitas, F., & Serrano, F. (2015). Growth rate and level effects, the stability of the adjustment of capacity to demand and the Sraffian supermultiplier. Review of Political Economy, 27(3), 258-281.
Girardi, D., & Pariboni, R. (2020). Autonomous demand and the investment share. Review of Keynesian Economics, 8(3), 428-453.
Girardi, D., Paternesi Meloni, W., & Stirati, A. (2020). Reverse hysteresis? Persistent effects of autonomous demand expansions. Cambridge Journal of Economics, 44(4), 835-869.
Lanzillotti, R. F. (1958). Pricing objectives in large companies. The American Economic Review, 48(5), 921-940.
Lanzillotti, R. F. (1959). Pricing objectives in large companies: Reply. The American Economic Review, 49(4), 679-687.
Paternesi Meloni, W., Romaniello, D., & Stirati, A. (2021). On the Non-Inflationary effects of Long-Term Unemployment Reductions. Institute for New Economic Thinking Working Paper Series, (156).
Pierce, J. R., & Wisniewski, E. (2018). Some characteristics of the decline in manufacturing capacity utilization (No. 2018-03-01-2). Board of Governors of the Federal Reserve System (US).
Ramey, V. A. (2020). The macroeconomic consequences of infrastructure investment (No. w27625). National Bureau of Economic Research.
Appendix I. Data.
Capacity utilisation by country (1998Q1-2017Q4). Source: OECD; Business Tendency Surveys; https://stats.oecd.org/index.aspx?queryid=305. Quarterly data (1998Q1 – 2017Q4).
Capacity utilisation in the United States (1948Q1 – 2021Q1). Source: Board of Governors of the Federal Reserve System (US), Capacity Utilization: Manufacturing (SIC) [CUMFNS], retrieved from FRED, Federal Reserve Bank of St. Louis; https://fred.stlouisfed.org/series/CUMFNS, July 15, 2021. Quarterly data (1948Q1 – 2021Q1).
Manufacturing production index in the United States (1948Q1 – 2021Q1). Source: Board of Governors of the Federal Reserve System (US), Industrial Production: Manufacturing (SIC) [IPMANSICS], retrieved from FRED, Federal Reserve Bank of St. Louis; https://fred.stlouisfed.org/series/IPMANSICS, July 15, 2021. Quarterly data (1948Q1 – 2021Q1).
Manufacturing productive capacity index in the United States (1948Q1 – 2021Q1). Source: Board of Governors of the Federal Reserve System (US), Industrial Capacity: Manufacturing (SIC) [CAPB00004SQ], retrieved from FRED, Federal Reserve Bank of St. Louis; https://fred.stlouisfed.org/series/CAPB00004SQ, July 15, 2021. Quarterly data (1948Q1 – 2021Q1).
Consumer price index in the United States (1948Q1 – 2021Q1). Source: U.S. Bureau of Labor Statistics, Consumer Price Index for All Urban Consumers: All Items in U.S. City Average [CPIAUCSL], retrieved from FRED, Federal Reserve Bank of St. Louis; https://fred.stlouisfed.org/series/CPIAUCSL, July 15, 2021. Quarterly data (1948Q1 – 2021Q1).
Santiago J. Gahn is a Postdoctoral Research Fellow at Università Cattolica Sacro Cuore di Milano (CRANEC). He tweets at @sjgahn.
A similar version of this post was originally published in “Central de Ideas”, the official blog of the Banco Central de la República Argentina (BCRA). The author would like to thank Ramiro E. Álvarez, Ariel Dvoskin and Riccardo Pariboni for their comments, which helped to substantially improve this post.
